


 83 / 492

08:57 - 09:00
S4-7
(PP)
DELAYED UPPER TRACT DRAINAGE (UTD) ON VOIDING CYSTOURETHROGRAM
(VCUG) IS NOT ASSOCIATED WITH INCREASED RISK OF URINARY TRACT
INFECTION (UTI) IN CHILDREN WITH VESICOURETERAL REFLUX (VUR)
Michael GARCIA-ROIG
1
, Angela ARLEN
1
, Jonathan HUANG
1
, Elanora FILIMON
1
, Traci LEONG
2
and Andrew KIRSCH
1
1) Emory University School of Medicine, Department of Pediatric Urology, Atlanta, USA - 2) Emory University Rollins
School of Public Health, Biostatistics and Bioinformatics, Atlanta, USA
PURPOSE
VUR with delayed UTD on VCUG was reported to correlate with increased UTI risk (Park et al., J Urol, 2011) We sought
to determine whether delayed UTD can be reliably classified, and whether it correlates with UTI incidence, VCUG or
endoscopic findings.
MATERIAL AND METHODS
Children undergoing endoscopic surgery for primary VUR (2009-2012) were identified. VUR grade, timing, and laterality
were abstracted. Demographics, hydrodistension (HD) grade, reported febrile and culture-proven UTI were assessed.
UTD on VCUG was graded on postvoid images as: 1- partial/complete UTD or 2- no/increased UTD. Inter-observer
agreement was calculated. Patients were excluded for incomplete imaging, or inability to void during VCUG.
RESULTS
The cohort included 128 patients (10M,118F) with mean age 4.1±2.1 yrs. Mean age at diagnosis was 2.8±2.8 yrs. Mean
maximum VUR grade was 3±0.9: 1(10%), 2(26%), 3(55%), 4(33%), 5(4%). UTD occurred in 47(36%), and no
drainage in 84(64%) patients. Agreement coefficient between graders was 0.596 (p<0.0001).
Cultures were available in 105 patients (73 positive). Patients experienced a mean of 2±1.2 parent-reported and
1.2±1.2 culture proven UTIs from birth to surgery. UTI rate (reported and culture-proven) among drainage groups did
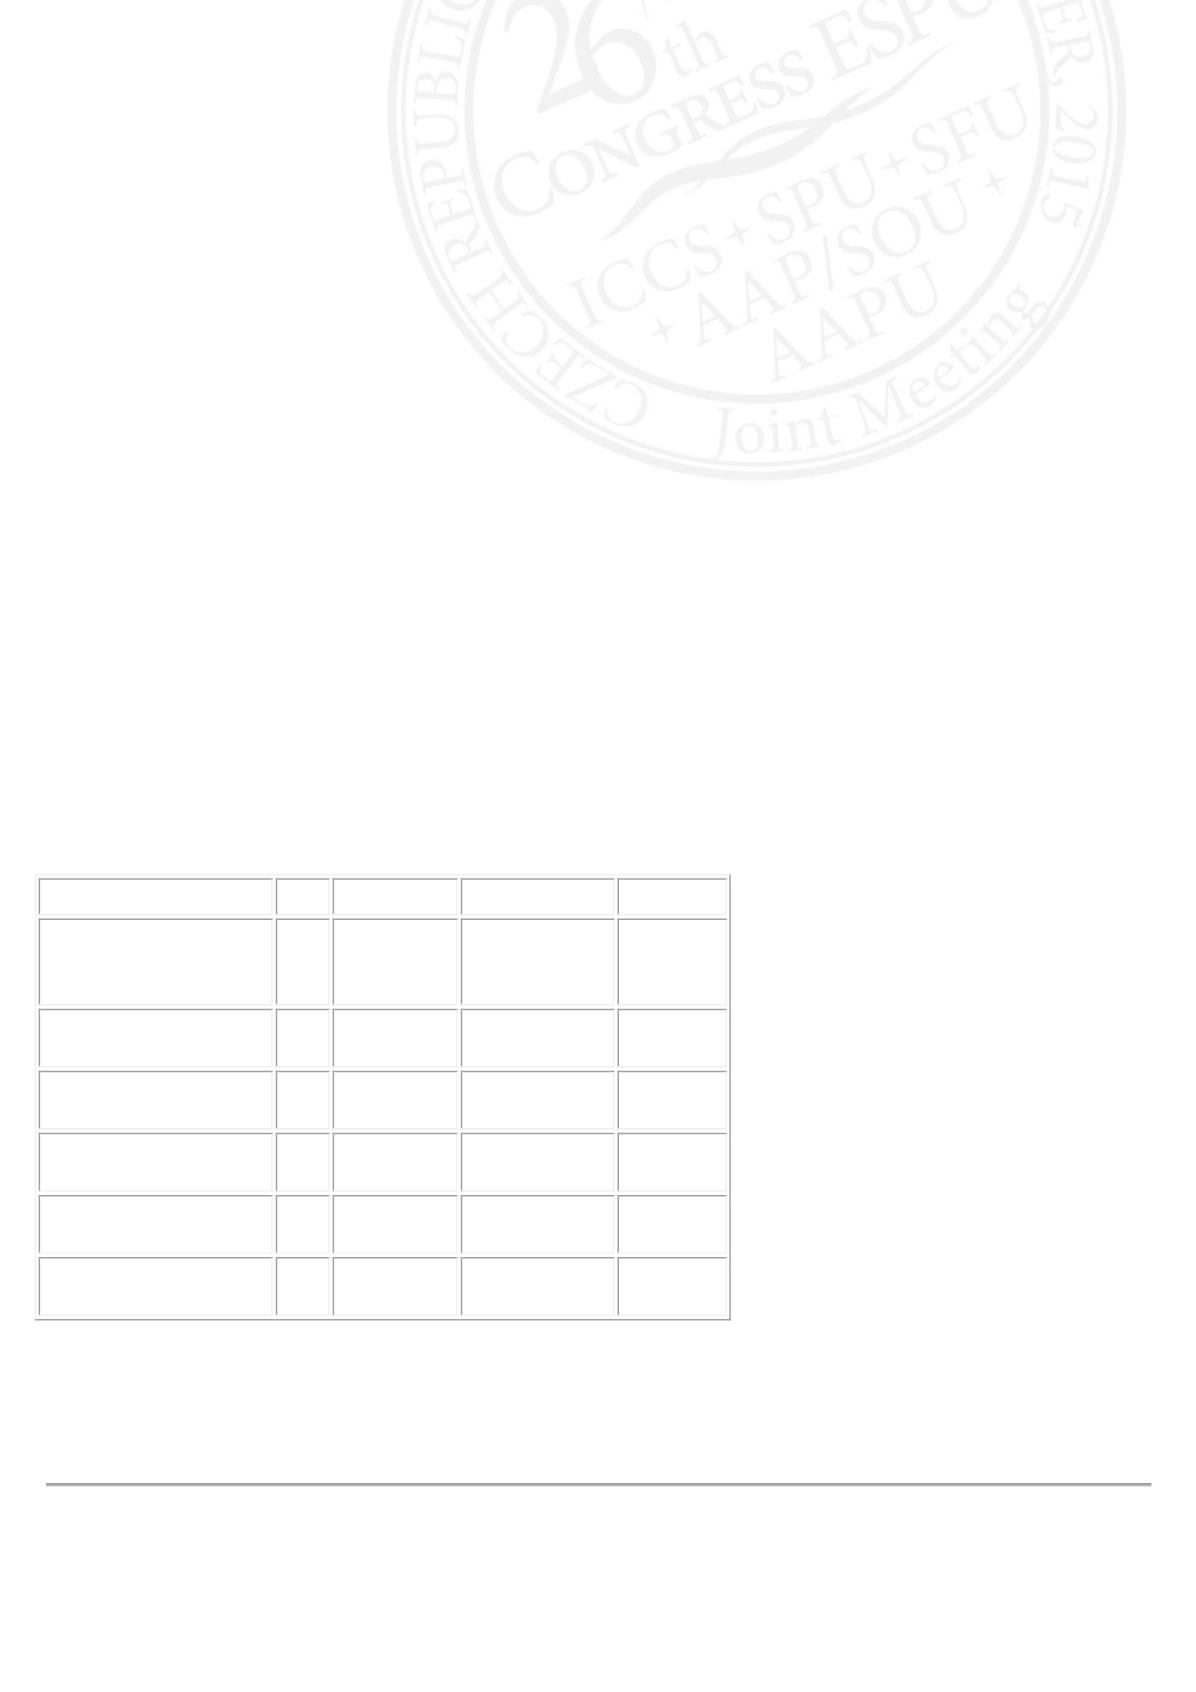
not differ by maximum VUR (p=0.1; p=0.49) or HD grade (p=0.87; p=0.14), or VUR timing (p=0.97; p=0.46). Table 1
outlines UTI rate by drainage.
N
Mean (SD) Median (mad) p
UTI rate/YR-
Parent Reported UTI
Complete or >filling
UTD
45 .66(.53)
47(.28)
.71
Unchanged or >filling
UTD
83 .7 (.5)
.62 (.33)
UTI Rate/Year-
Positive Culture
Complete or >filling
UTD
24 .746(.657) .47
0.1664
Unchanged or >filling
UTD
49 .538(.410) .441
CONCLUSIONS
UTD can be reliably scored using a binary system with high inter-observer correlation. Our data shows that children with
delayed UTD are not at increased risk for recurrent UTI, higher HD or VUR grades vs those with UTD.